I Built a Usage Tracker for My AI Agents
I run three AI coding tools: Claude Code, Codex and Antigravity. Each plan has limits on how much you can use in a five-hour stretch and how much in a week. Hit one halfway through a job and that tool stops until it resets.
I wanted to see every limit in one place, so I'd know one was coming before I hit it. This week I added that to Agent Estate, the dashboard I built to keep an eye on my agents. This is how it works and how I made sure the numbers are right.
Asking each tool
Each tool already has a built-in command that shows your usage. The tracker runs those commands itself, without a person at the keyboard (headless), and reads what comes back:
- Claude Code:
claude -p "/usage" --output-format json. It's a built-in command, so no AI model is involved: it uses none of the allowance it's measuring (0 tokens) and takes about four seconds. - Codex: Codex has a connection meant for other programs to talk to it (its app server). The tracker starts it, introduces itself, and asks one question,
account/rateLimits/read. That's the same data Codex's own/statusscreen shows. Under a second. - Antigravity:
agy -p "/usage" --output-format json, which hands back neatly organised numbers (structured data).
All three are asked at the same time, so a full check takes about as long as the slowest one, around five seconds.
My agent's first attempt took a shortcut. It read the numbers from the file Codex saves for each session, where Codex notes your usage as it goes. The newest of those files was a day and a half old and said 83% of the week was used. Asked directly, Codex said 0%: a new week had started since. A saved file only knows what was true when it was written, so the tracker always asks the tool.
Reading three different answers
The three tools answer the same question in three completely different shapes. This is most of the actual work.
Claude Code answers in sentences. The data comes wrapped in a machine-readable envelope (JSON), but the useful part inside is plain text meant for a person:
Current week (all models): 53% used · resets Oct 10 at 12:59pm (Europe/London)
Current week (Fable): 93% used · resets Oct 10 at 12:59pm (Europe/London)
So the tracker matches each line against a pattern (a regular expression) that pulls out four things: which limit it is, whether it's the five-hour or the weekly one, the percentage, and the reset time. Two details took care. The text leaves out the year, so a reset date that seems to be well in the past is moved to next year (otherwise "Jan 2" read on 30 December lands eleven months ago). And if a line's reset time can't be understood, the percentage is kept with the original wording rather than thrown away.
Codex answers in pure data. Each limit comes with a percentage used, the length of the window in minutes and a reset time. The tracker turns the minutes into names, 300 into "5-hour" and 10,080 into "weekly", and picks up two extras along the way: which plan you're on, and how many free resets you have left.
Antigravity counts the other way. It reports how much you have left, as a fraction. Its models are also grouped (Gemini in one group, Claude and GPT in another), each with its own five-hour and weekly limits. The tracker turns "0.25 left" into "75% used" so it lines up with the other two.
Whatever comes in, each tool ends up as the same list:
{
  "kind": "week",
  "scope": "Fable",
  "used_pct": 93.0,
  "resets_at": 1791633600
}
That common shape (one format, with a small translator per tool) is what keeps the rest simple. The display never has to know which tool a number came from, and adding a fourth tool means writing one more translator.
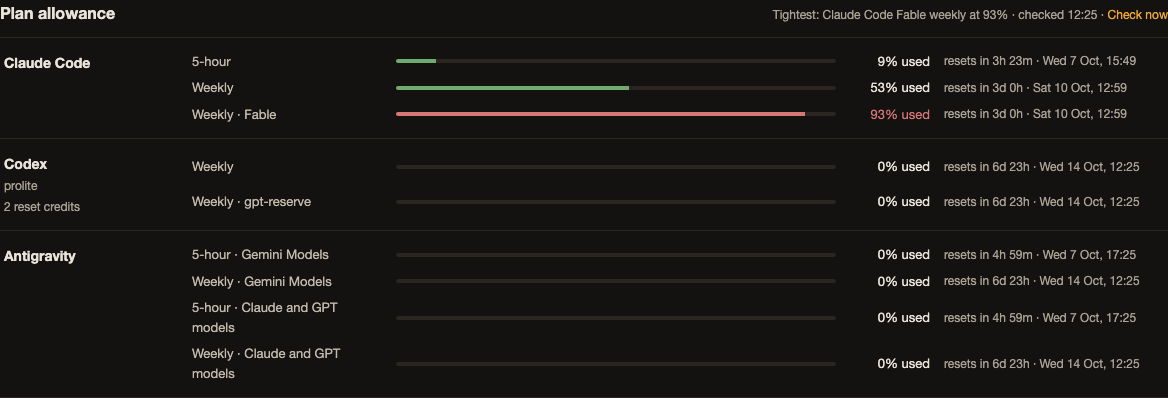
Finally the tracker sorts each tool's limits, main limit first and five-hour before weekly, and picks out the single limit closest to running out across all three. That's the one that matters. In the example above, my overall Claude Code week was at 53%, but one model has its own weekly limit, and that was at 93%. Watching the headline figure alone, I'd have hit a wall with half my week apparently left.
From the numbers to the screen
The server keeps the last answer ready. Asking all three tools takes about five seconds, too long to make the page wait every time. So Agent Estate's server keeps the latest result in memory and saves a copy to disk. The page gets an answer instantly, and if that answer is more than ten minutes old, a fresh check starts in the background. Only one check runs at a time, however many times the page asks. After a restart the saved copy means numbers appear straight away instead of a blank panel. The "Check now" button is the one exception: it waits for a fresh answer.
The panel keeps its countdowns honest. The page asks the server again every minute, so "resets in 3d 0h" counts down as you watch, even between checks. Every limit gets a bar, amber at 75% and red at 90%, with the time left and the exact reset time beside it. The tightest limit is spelled out at the top along with when it was last checked.
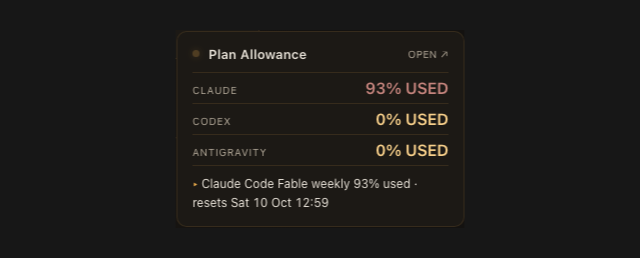
The desktop gets the short version. My command centre, the dashboard that sits on my desktop, reads the same answer from Agent Estate. It shows one line per tool at that tool's most-used limit, and flags anything at 80% or more with its reset time. It says when the numbers are more than half an hour old, and shows the tile as down if Agent Estate isn't answering at all.
How I checked it works
It never shows an old number as if it were current. If a tool doesn't answer, times out or isn't installed, that line says "Couldn't read" or "Not installed" with no figure. One broken tool doesn't blank out the others.
A changed format is an error, not a zero. If a tool rewords its answer and the pattern finds nothing, the tracker reports that it couldn't read the output. It never quietly reports "no limits", which would look exactly like "all fine".
It guards against the costly failure. If Claude Code ever stopped treating /usage as a built-in command, the request would go to the AI model and use up the allowance it's meant to be measuring. Claude Code's answer says whether it was a built-in command and how many model turns it took, so the tracker checks both and reports anything else as an error. It also asks for the cheapest model, so even a slip costs as little as possible.
16 tests, built from real answers. I captured what each of the three tools actually returns and built the tests from that, plus the ways they can go wrong: a timeout, a tool that isn't installed, a reworded answer, a reset date in January seen from December. The desktop tile has 5 more of its own.
Then I broke it on purpose. I had the agent remove two of those protections, the costly-failure check and the new-year handling, and ran the tests again. The matching test failed each time. A test that still passes when you break the code isn't testing anything.
And I checked it where it really runs. The dashboard runs as a background service on my Mac. Background services start with a much shorter list of places to look for programs than my terminal has, a classic way for something to work by hand and fail on its own. So the tracker also looks in the places these tools are usually installed, and I checked it through the service itself: all three tools came back with real numbers. Then I looked at the panel on screen.
Why I build this kind of thing
I spend my days running agents, and most of the work isn't the agents themselves. It's everything around them: seeing what they did, knowing what they cost, and checking that what they report is true. This tracker is a small piece of that. It's also the kind of work I want to keep doing.