My Harness Was Invisible. So I Built It an Observatory.
My harness — the memory files, the skills, the hooks, the crons, the enforcement scripts wrapped around my AI agent — has quietly become a real system. Nine self-authored skills. Seven hooks across five lifecycle events. 135 memory files. An unattended triage loop.
And until last week it was invisible. All of it lives in dotfiles. The only interface was VS Code and grep: editing a skill meant digging through a config directory, checking harness health meant remembering what to look for, and if a skill's performance had quietly regressed, there was nothing to look at. No way to know at all.
So I built it an observatory — a small local UI where I can see the whole harness and change it in place. Edit skill files. Browse and correct memory. An overview of the hooks and the crons. And the screen the whole thing is building towards: evals, because the endgame is measuring what my skills actually let a model do.
This post is the tour, and the argument underneath it. In my own words, from the note I wrote that day: "I'm versioning my harness and testing it as I go along to actually improve." The harness is a product. It has versions, a changelog, tests, and now a dashboard. Here are the receipts.
First, the audit: where was I actually?
The day before, I'd done something uncomfortable: graded my own AI adoption against a five-step ladder. 0 is Gated (org blocks AI), 1 is Assisted (human drives, AI helps inline), 2 is Parallel (multiple agents in flight, human orchestrates in-session), 3 is Supervised Autonomy (model-driven work runs cross-session or headless, human reviews), 4 is AI-native.
I made the assessment adversarial on purpose. No vibes, no credit without a config file to cite. The result:
Personal operating level: 2.7. Org ceiling: about 3.5 effective.
Every Step-2 marker, met with evidence. A ~20-entry pre-approved command allowlist. Twelve-plus background agents in a single session, routinely. Parallel work isolated in git worktrees. A stop-hook running seven machine-enforced checks before the agent may declare work finished — it blocked a premature "done" the day before the audit, which is exactly the kind of receipt I wanted.
The Step-3 structure also existed: nine self-authored skills (one of them semver'd, more on that shortly), seven hooks across five lifecycle events, 135 memory files, a weekly self-review skill that mines session transcripts for friction.
But Step-3 operation? Missing, and the evidence of absence was just as concrete. Zero headless invocations anywhere in my history. My one cron loop deliberately runs zero model calls. The self-improvement loop is human-triggered. The project-local allowlist file: empty.
So the audit named a single bottleneck: every loop terminates in my live attention. Nothing model-driven starts, verifies, or lands without me in the session. My throughput is my synchronous hours. That's the wall between 2.7 and 3.
Hold that thought — the bottleneck matters for everything that follows. Because the day after I wrote it down, I turned the same adversarial lens on my own memory system.
Then I measured the overlap
Some context first. Claude Code has had native auto-memory since February (shipped in v2.1.59) — a memory directory, an always-loaded index file, topic files pulled in on demand, persistence every turn. I've known about it the whole time; I prune that index myself. In my harness it was never the whole memory system: MEMORY.md is the working tier, and anything durable migrates into a knowledge graph, so important information doesn't get lost when the index gets pruned — it gets promoted to long-term memory.
But with the native tier doing more every release, the uncomfortable question was worth asking properly: had I built something obsolete? Native auto-memory does, out of the box, most of what my hand-built memory substrate does. Memory directory. An index file auto-loaded at session start, with a soft limit (first 200 lines, ~25KB, then a warning). Frontmatter handling. Topic files loaded on demand. Persistence as you go. Plus /memory, /context and /recap commands for basic inspection.
I'd built all of that. File by file, convention by convention, over a year. And now it's a bullet point in someone else's release notes.
If you've ever built internal tooling, you know this moment. The platform ships your side-project. The correct response is not to defend the artefact — it's to work out, honestly, which parts just became free and which parts didn't. So I sat down with the current docs and ran the comparison, column by column.
The verdict: substrate versus layer
Three columns came out of the audit.
Redundant — the substrate. The storage layer itself: memory directory, auto-loaded index, topic files, per-turn persistence. Native now. Mine still works, but maintaining a bespoke version of something the platform does for free is a hobby, not an edge.
Partially redundant. My prune gate is a hard cap — 120 lines on the index or fourteen days since last cleanup, whichever trips first, with overflow collapsed into pointer lines and finished work moved to an archive file that never loads. Native gives you a soft warning at 200 lines. A warning is not a gate; the discipline is still mine. Likewise the mechanical half of my session-start routine — deterministic enumeration of git activity, open reviews, board state — could now move into a startup hook script and cost zero model tokens. That one wasn't a loss at all. It was a to-do item the platform had just handed me.
Still differentiated — the layer above. No native equivalent exists for any of this:
- The wikilink graph. My memory files link to each other
[[like this]], which makes memory a traversable graph rather than a pile of files. Retrieval becomes deterministic graph-walking instead of hoping search finds the right note. And the graph is plain markdown, so it's tool-agnostic: native auto-memory is per-repository, machine-local, and Claude Code's alone, but every agent I run can read the same notes. Long-term memory that outlives any one tool. - The enforcement discipline. Consolidate-don't-append: a corrected fact replaces the stale line rather than piling a contradiction on top of it. Grep before you write, so the same entity never gets two divergent entries. An archive-and-retraction ledger so "why this changed" survives without taxing every session. None of that is a storage feature. It's editorial policy, machine-enforced.
- The cron warm-start — an unattended loop that does discovery before I sit down, so the session opens against fresh state.
- Skill evals. Nothing native measures whether a skill performs well, costs what it should, or degrades over time.
- Observability. The native
/memorycommand is a file lister. There is no way to see the memory system — its health, its shape, its drift.
Then I looked at that third column properly and noticed the thing that turned the question into a good day: the differentiated column was my roadmap. The graph — shipped. The enforcement — running. Evals and observability — the exact next two items on my list. Anthropic hadn't obsoleted my work; they'd taken over the boring bottom layer and validated everything I'd planned to build on top of it.
That's the commoditisation lesson, and it's older than AI tooling: when the substrate commoditises, build the layer above. Nobody runs a mail server as a differentiator any more; the interesting work moved up. Memory storage for coding agents just made the same transition. The value was never in the files — it was in the graph, the discipline, and the visibility layered over them.
The observatory: six screens over the harness
The fastest way to act on "the layer above is the product" was to build the piece of it I could see: observability. By the end of the same day I'd shipped it — a small local Next.js app I call the harness observatory. Six screens, each answering a question I previously answered by digging through VS Code:
Is the harness healthy? An overview screen: index size against the 120-line budget, plus red flags like that empty project allowlist the audit caught.
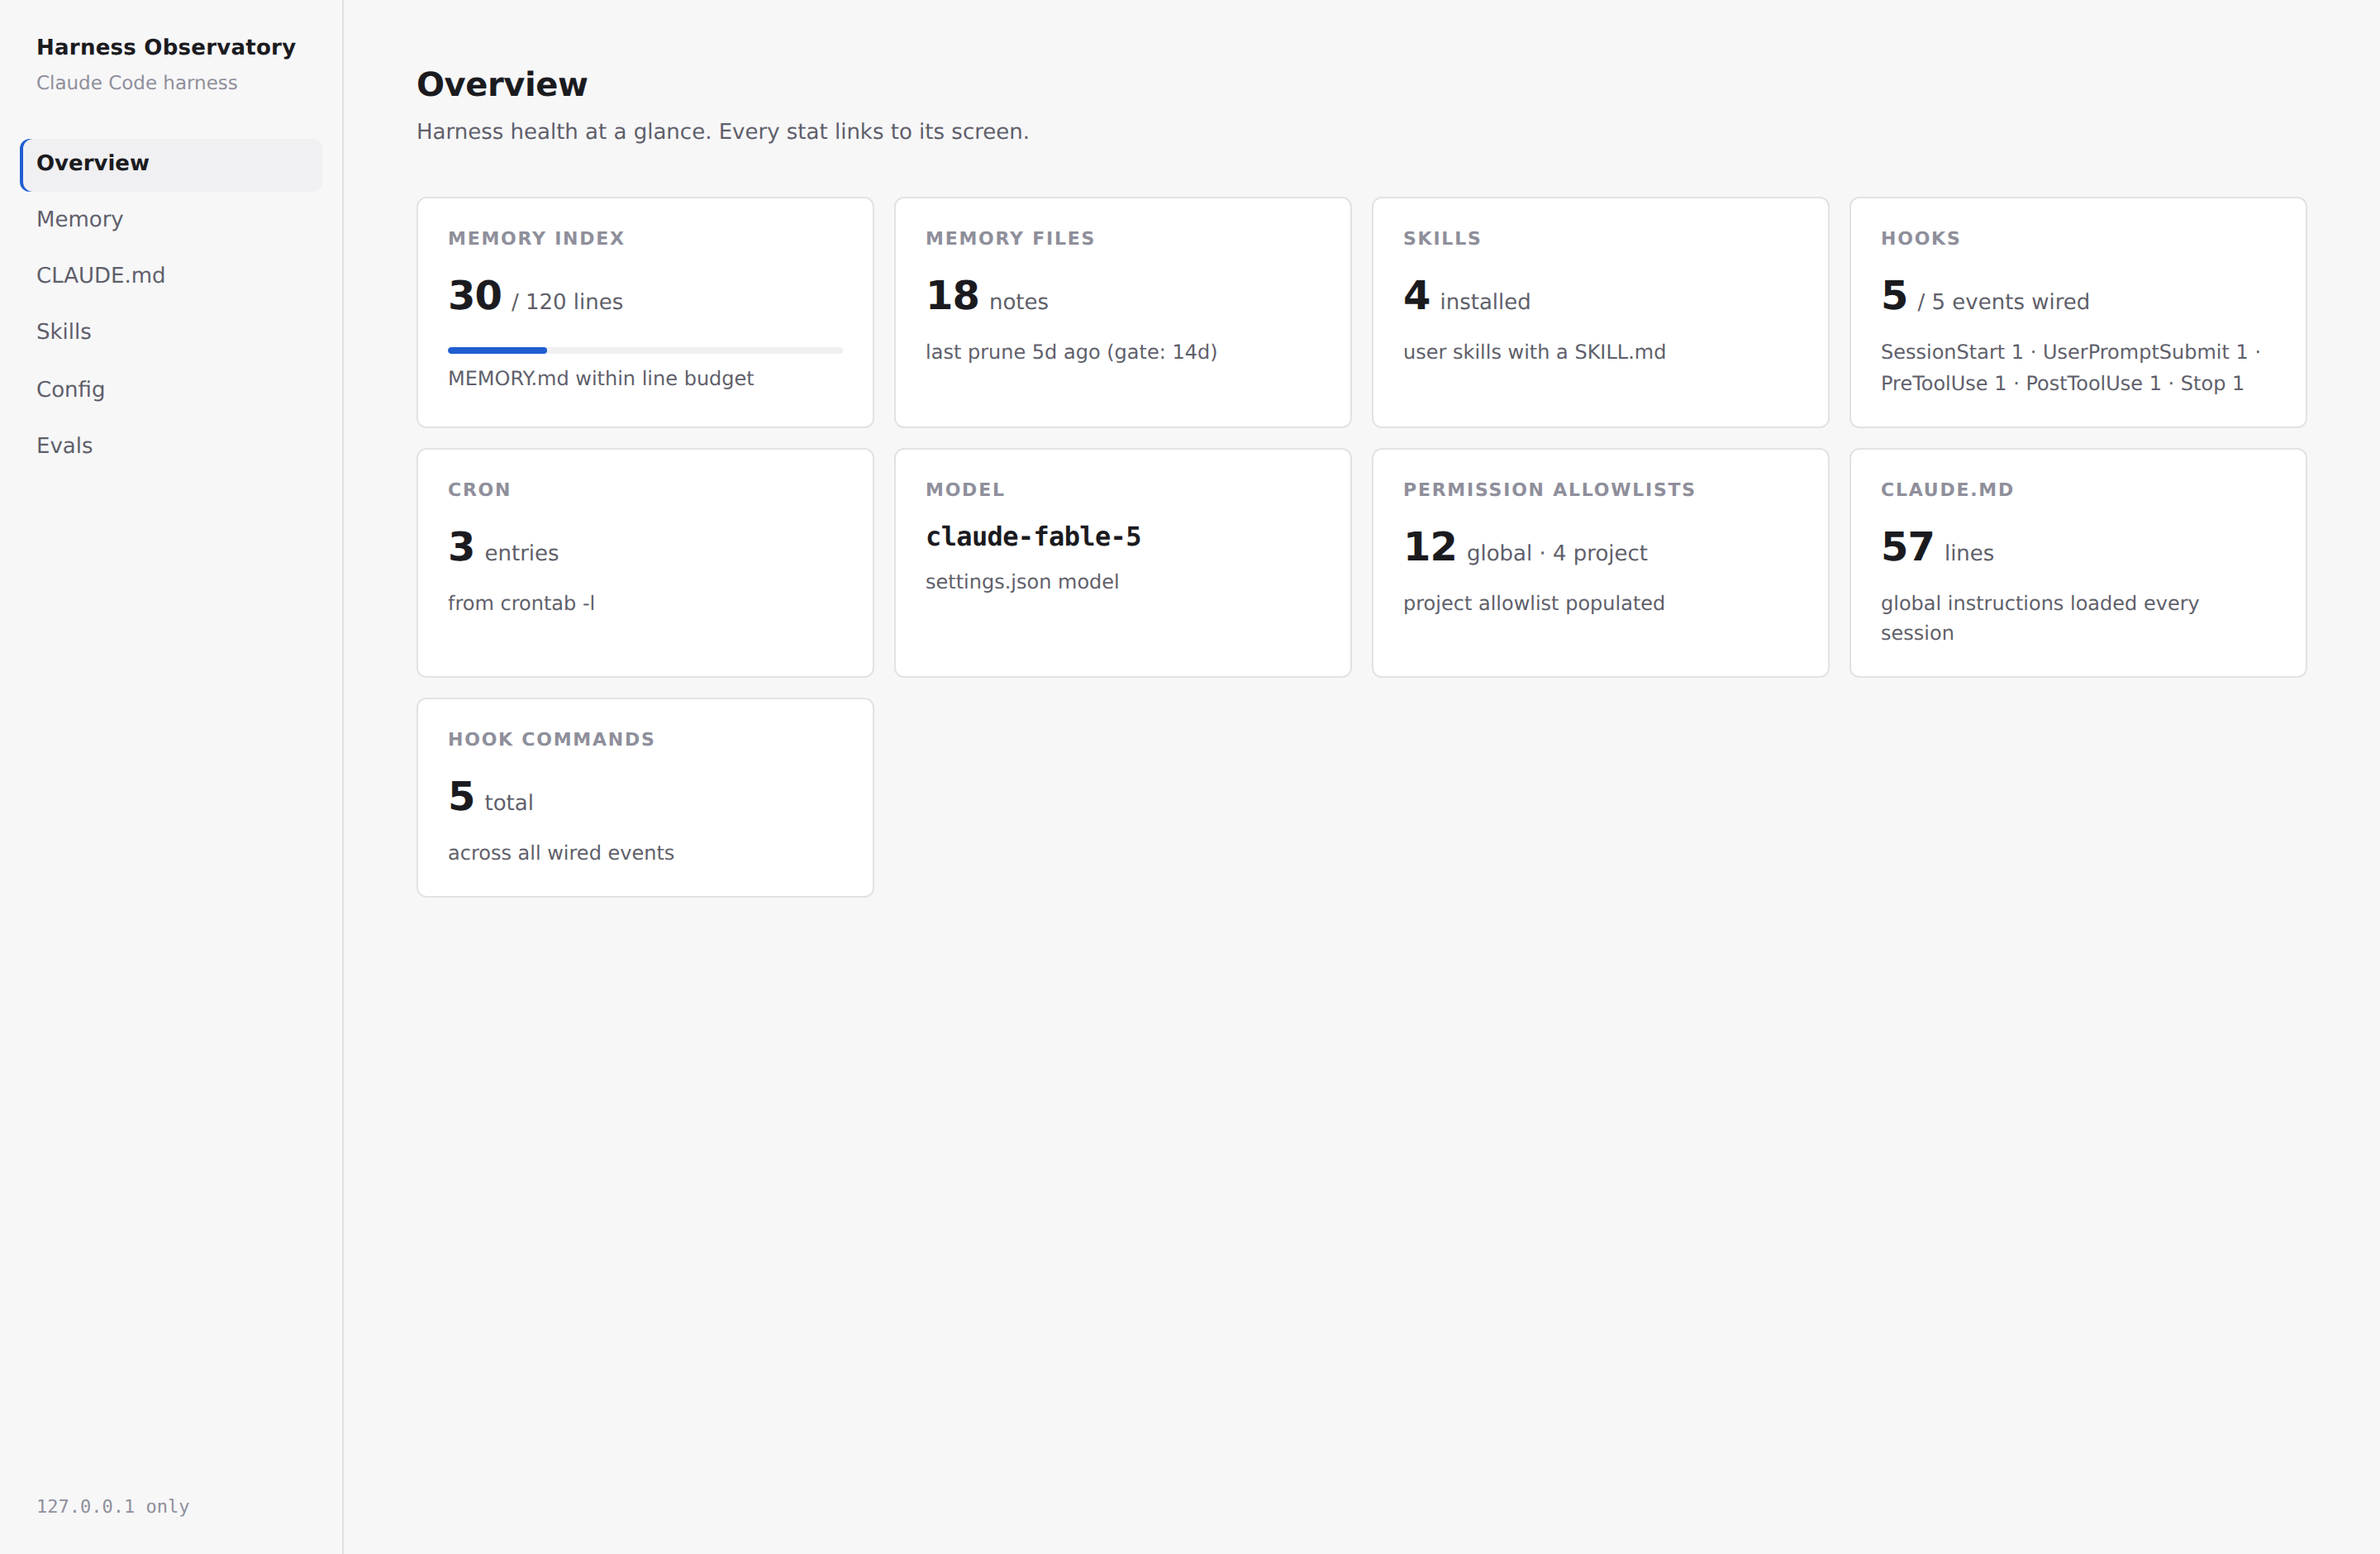 The overview screen: index line-count against the prune budget, with the audit's findings surfaced as health flags.
What shape is the memory? A force-directed graph built from the wikilinks — about 136 nodes and 389 edges, with the index pinned as the hub. It immediately flagged 11 orphan notes (nothing links to them) and 36 ghosts (linked-to notes that don't exist). I'd never have found those by listing files.
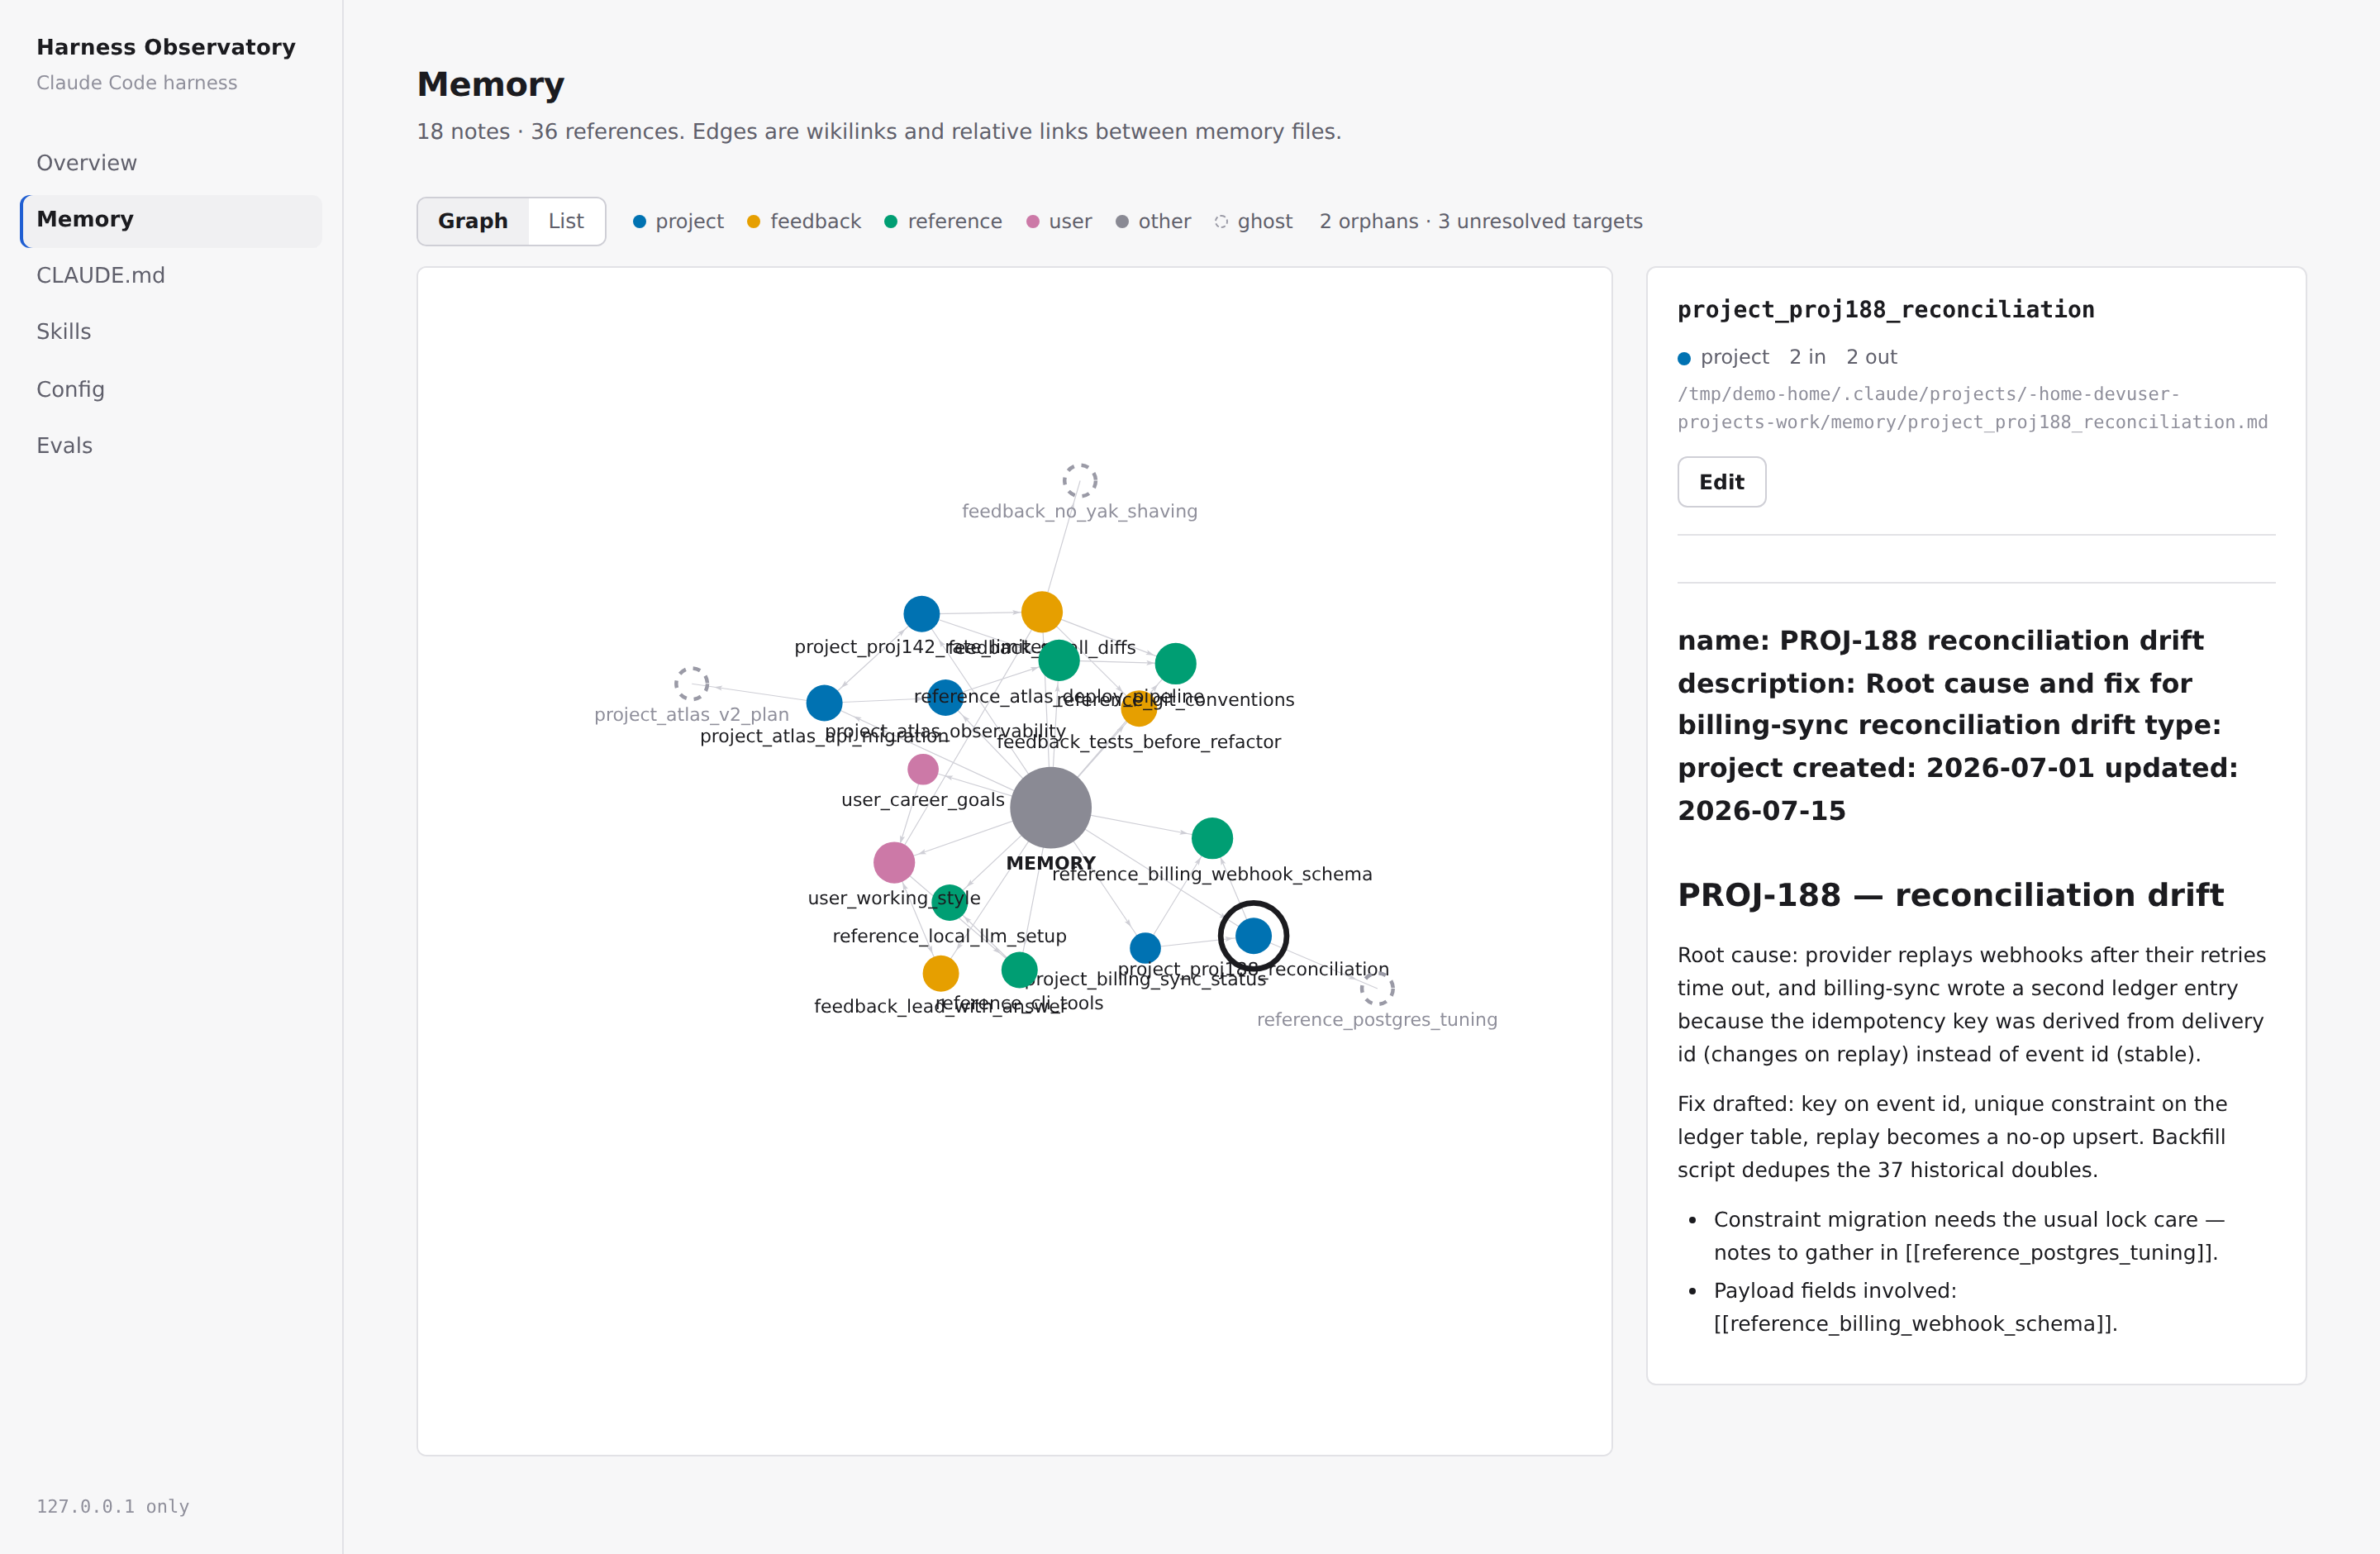 135 memory files as a graph rather than a directory listing. Orphans and ghosts — invisible in a file lister — are flagged on sight.
Can I fix what I see? Memory files are editable in place, with the guard-rails you'd give any editor over production data: a conflict check so a stale tab can't clobber a newer write, atomic writes, and a path allowlist that rejects traversal — verified live by watching it 403 an attempt to read a credentials file.
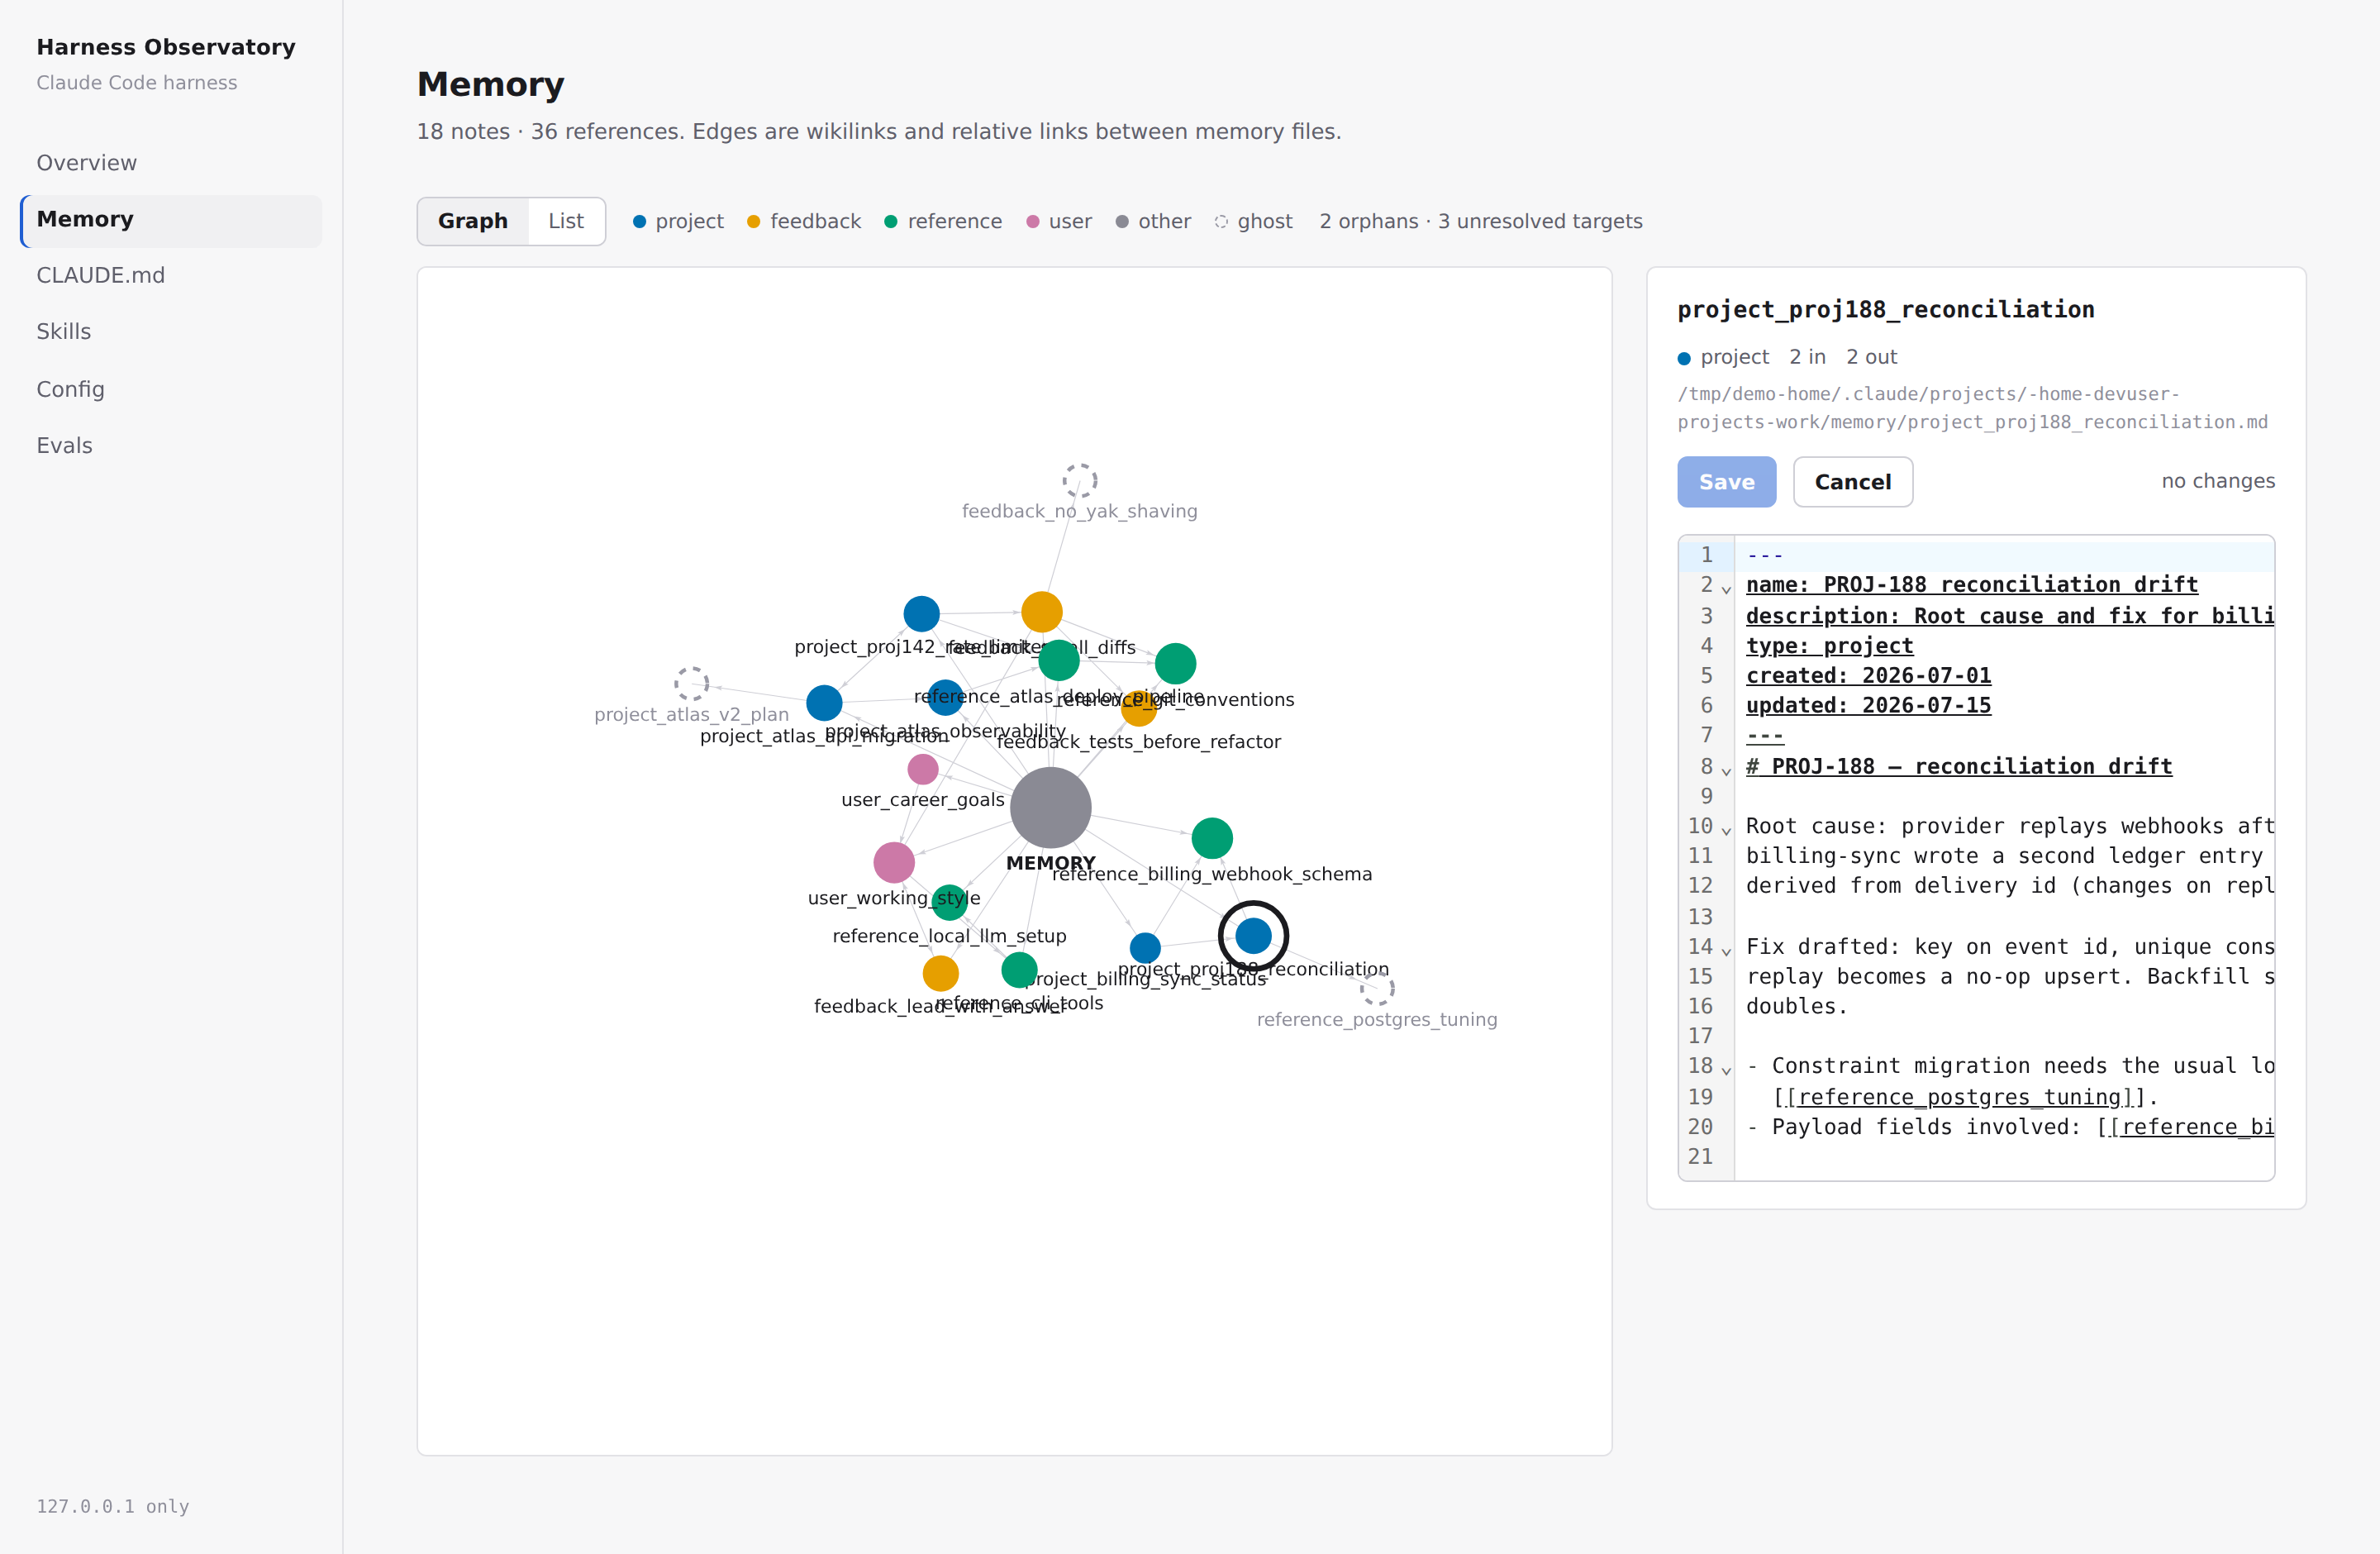 Edit mode: memory you can see is memory you can correct — with conflict detection, not blind overwrites.
What does the harness actually run? A config screen listing every hook and script, each one clickable through to a read-only syntax-highlighted view.
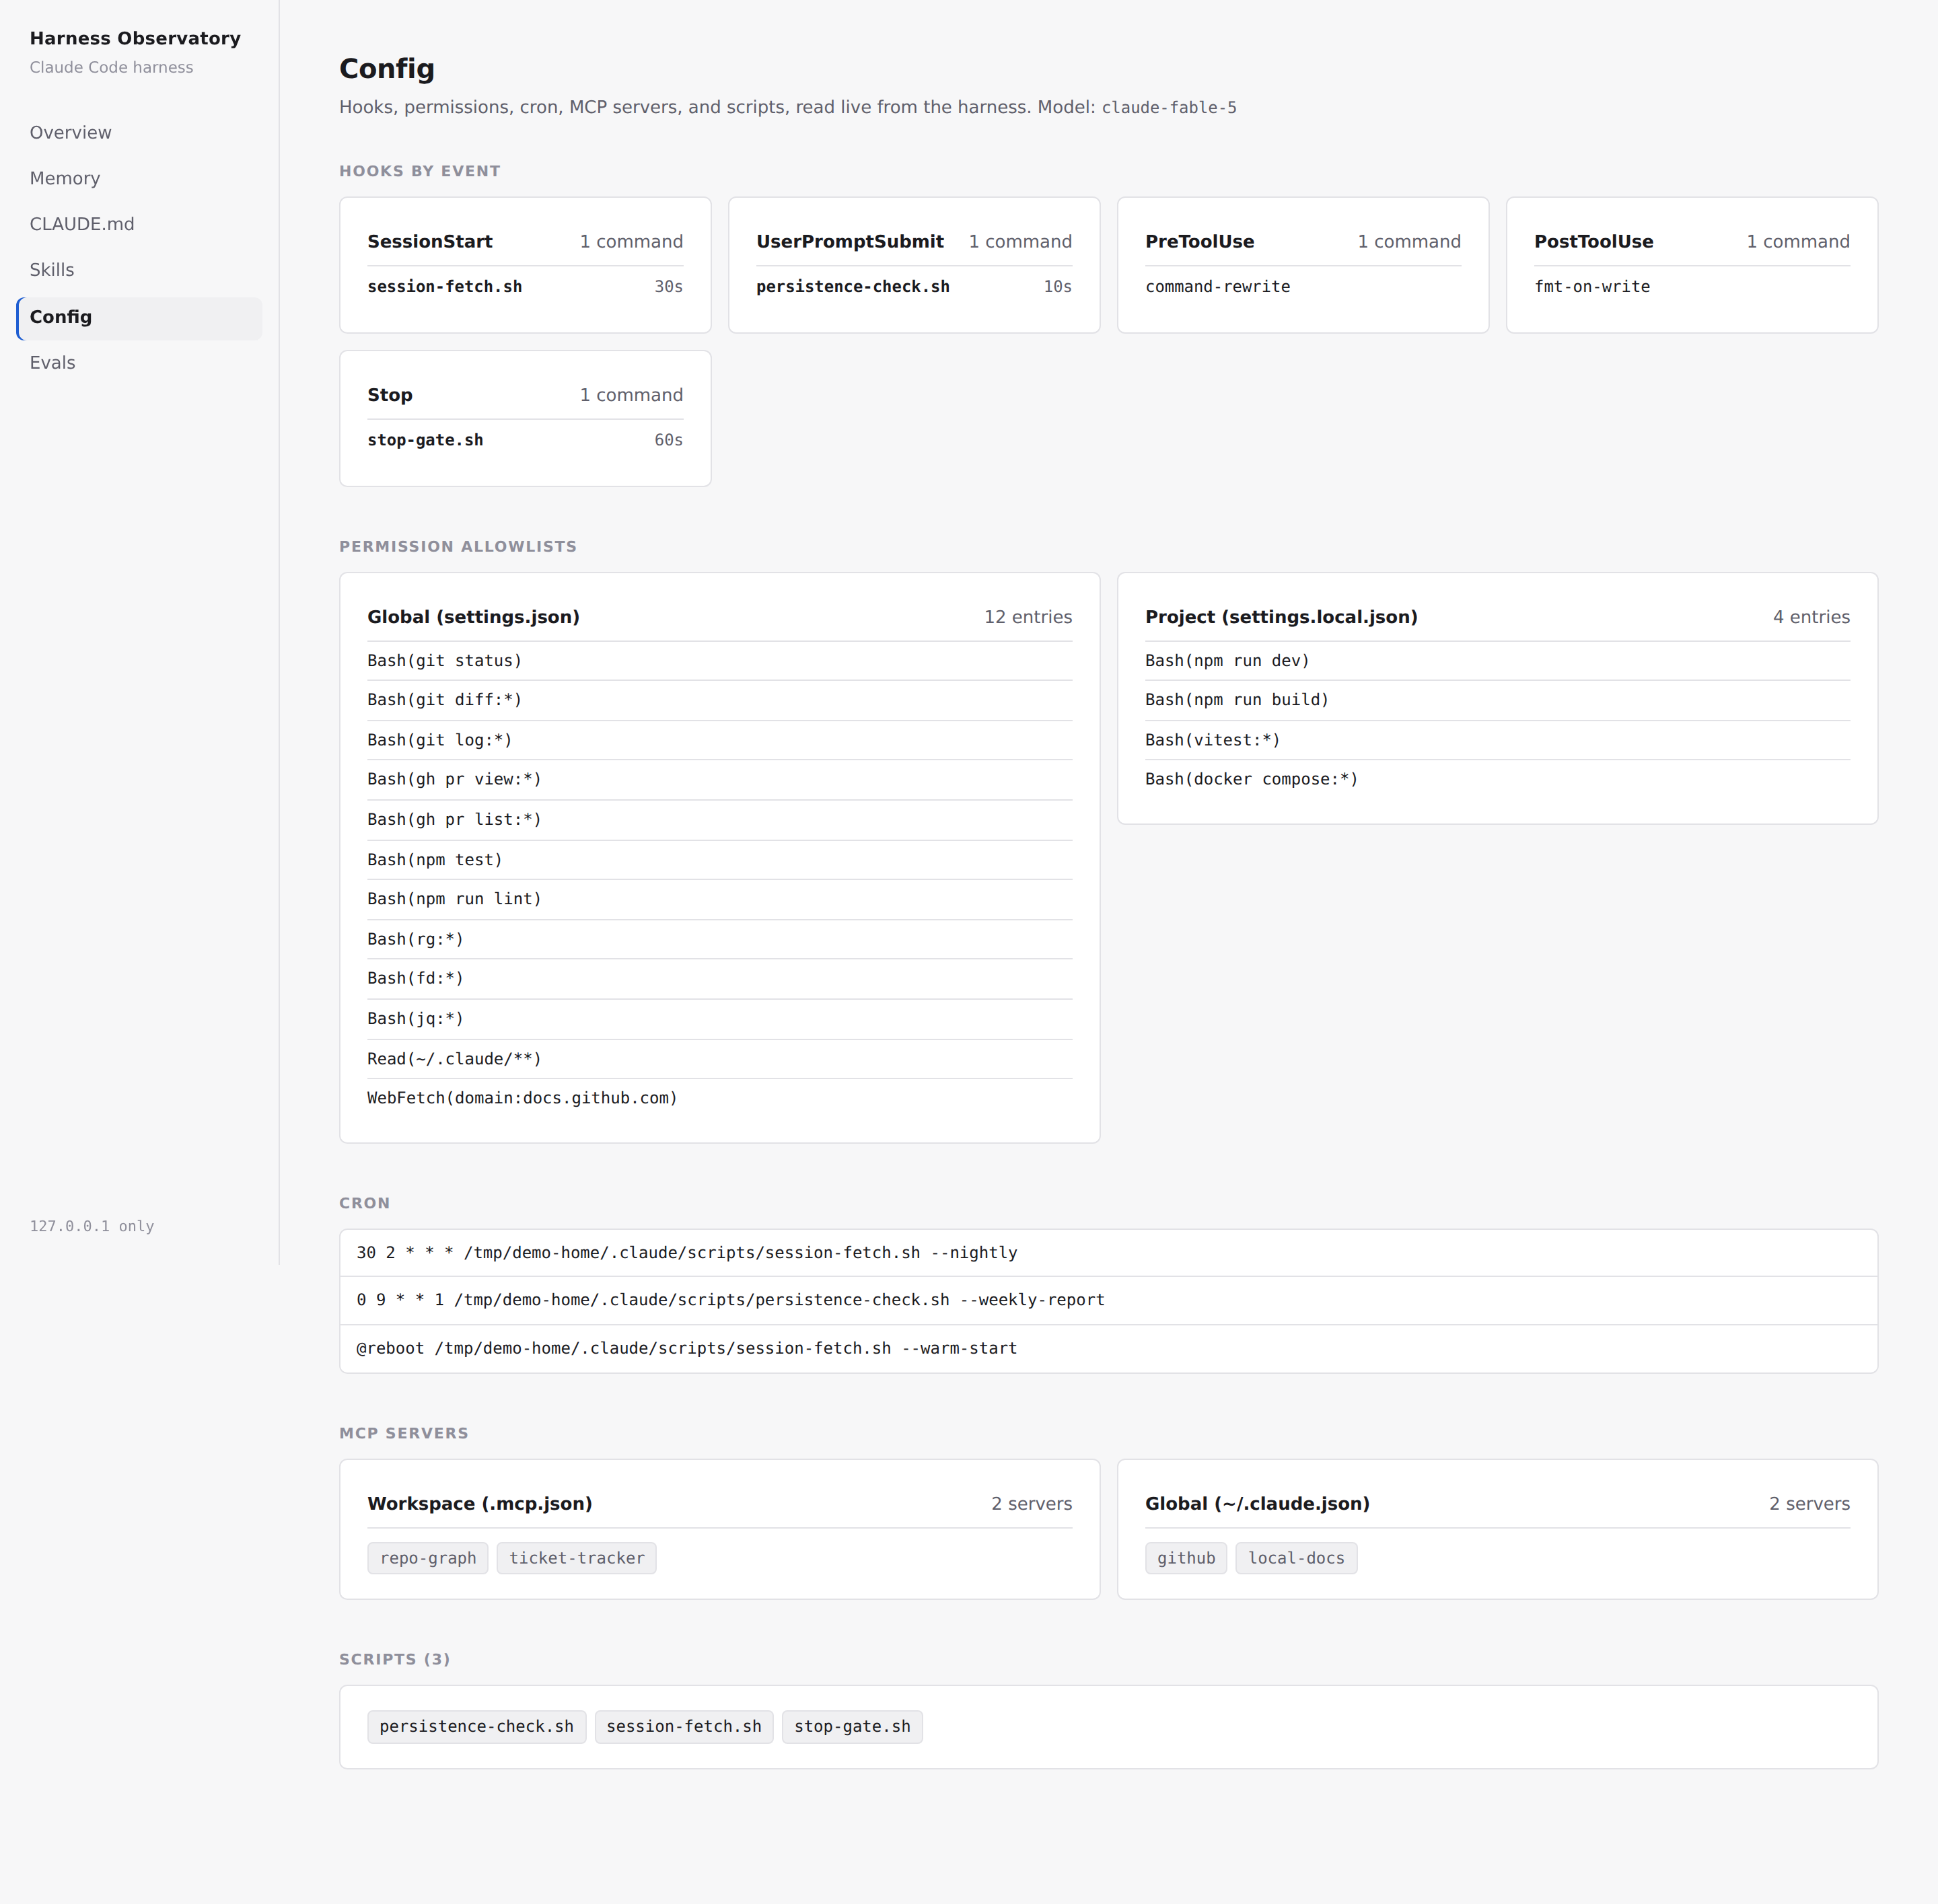 The config screen: seven hooks across five lifecycle events. This is the harness's CI — checks that run on every session whether I remember them or not.
That last screen is where a second framing clicked: hooks are the harness's CI. Memory is passive — the agent may or may not honour a written preference under pressure. A hook is a script the platform executes deterministically, every time, at a fixed point in the lifecycle. My stop-hook is a test suite the agent must pass before claiming completion. Any correction I find myself repeating gets promoted from note-in-memory to check-in-a-hook — from documentation to CI.
And I tested the dashboard like anything else I ship: a real test suite (24 green at v1, 37 now), every route exercised, rendered screens screenshot-checked in light and dark — which caught one genuine visual defect before I ever used the thing.
The trim, shipped as v1.5.0
Then I acted on the "partially redundant" column. The mechanical half of my session-start routine — the deterministic enumeration that previously ran through model-driven reader agents — moved into a single startup hook script. Roughly three seconds of shell and REST calls, zero model tokens, computing everything the session needs on open: prune-gate status, staleness of the overnight triage file, sprint boundary check, review comments awaiting a reply, git activity, pipeline failures on active repos. The reader agents didn't disappear; they're now the fallback for when a section of the script fails — and every section fails loudly, never silently.
On its first live run the hook caught two real deployment failures on my team's platform from the previous day. Three seconds, zero tokens, genuine signal.
Here's the part that makes this a post rather than a changelog entry: the change was a changelog entry. My session-start skill has been under semver since I captured a v1.0.0 baseline, with a policy I actually follow — MAJOR for a behavioural contract change, MINOR for a new step, PATCH for wording. The trim shipped as v1.5.0, a MINOR bump, with the reasoning recorded:
v1.0.0  baseline — capture the routine under version control
v1.1.0  reader-lane fan-out: heavy reads move to disposable agent windows
v1.2.0  boundary-triggered sprint rollover
v1.3.0  ticket-triggered code-graph warming
v1.4.0  overnight triage loop pre-computes discovery before the session opens
v1.5.0  the commoditisation trim: mechanical half moves to a zero-token
        startup hook; reader agents demoted to fallback
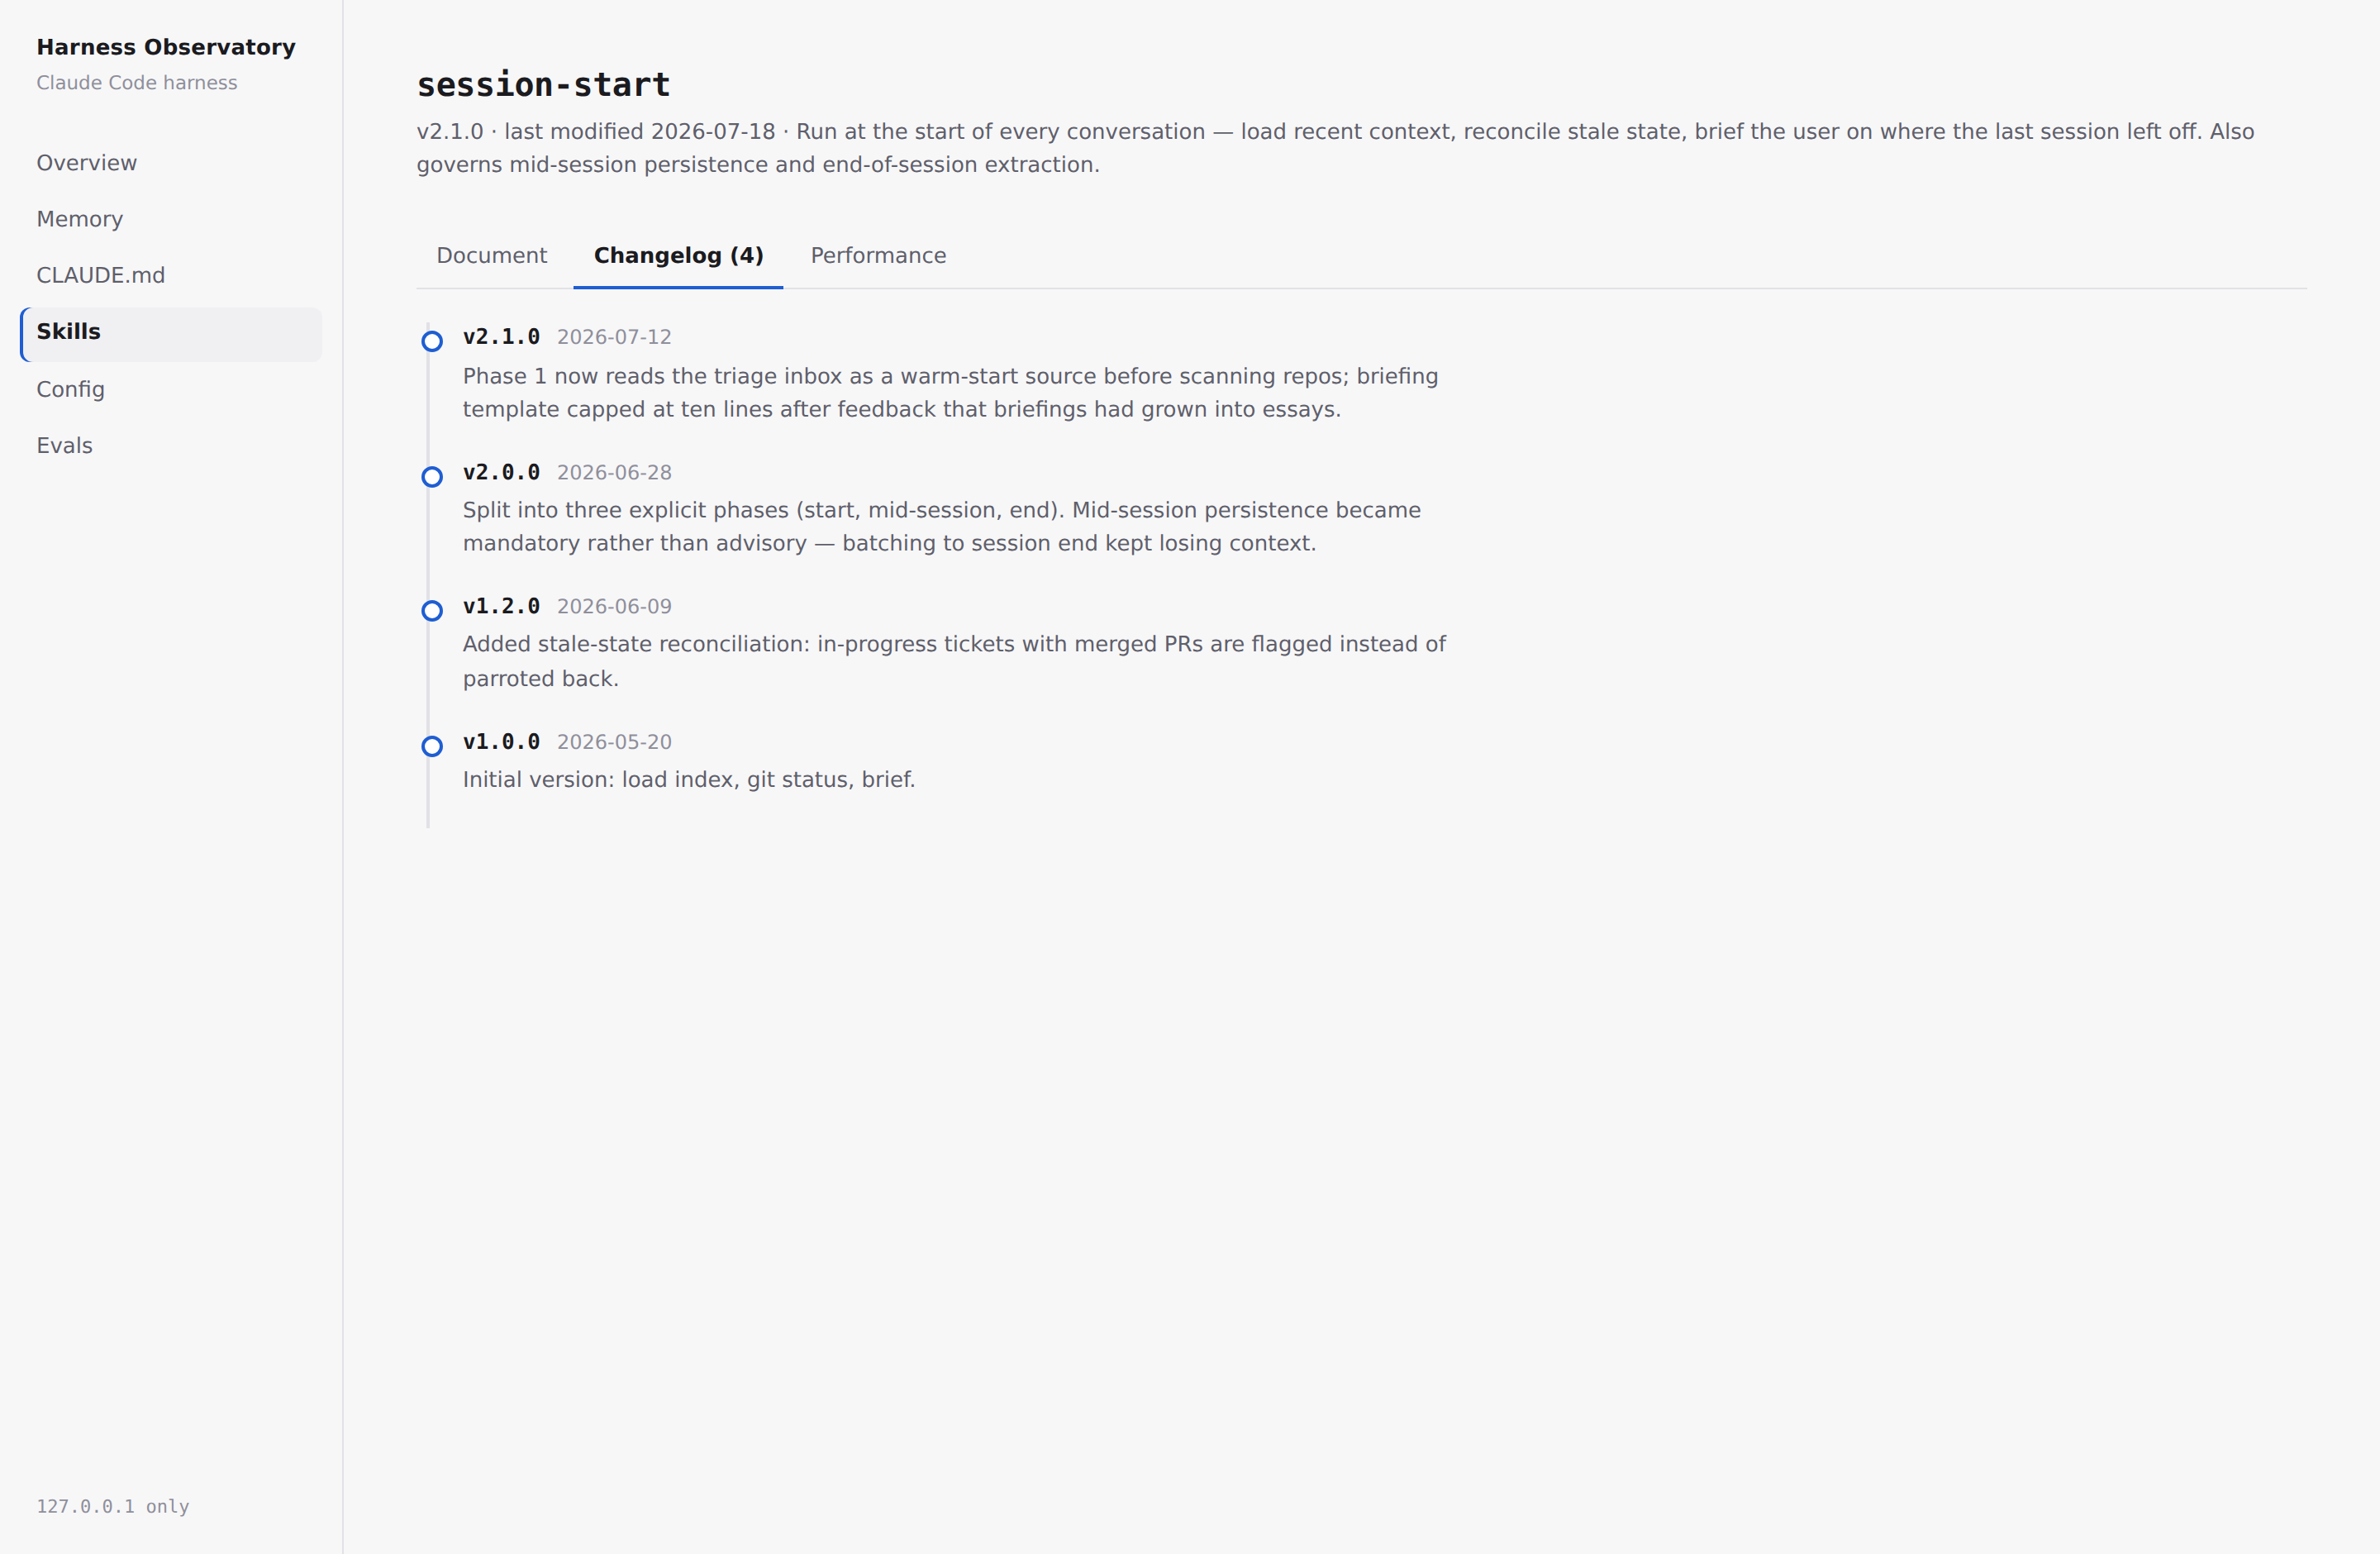 The skill's version history as a timeline in the observatory. Six versions, each with a recorded reason — "it feels worse lately" becomes a diff you can read.
Read that changelog as a trend line and you can see the harness converging on the audit's bottleneck: each version moves work out of my attended session — into disposable agent windows, then an unattended cron, now a zero-token hook. And v1.5.0 exists because the commoditisation audit identified the trim; the verdict went straight into the version history. That's what "harness as a product" means in practice. Not a philosophy — a workflow. Something shifts (a platform release, an audit finding, a repeated failure), the change lands as a versioned, reasoned, tested increment, and the dashboard shows the result.
The point of it all: evals
The observatory has a sixth screen, and it's deliberately empty.
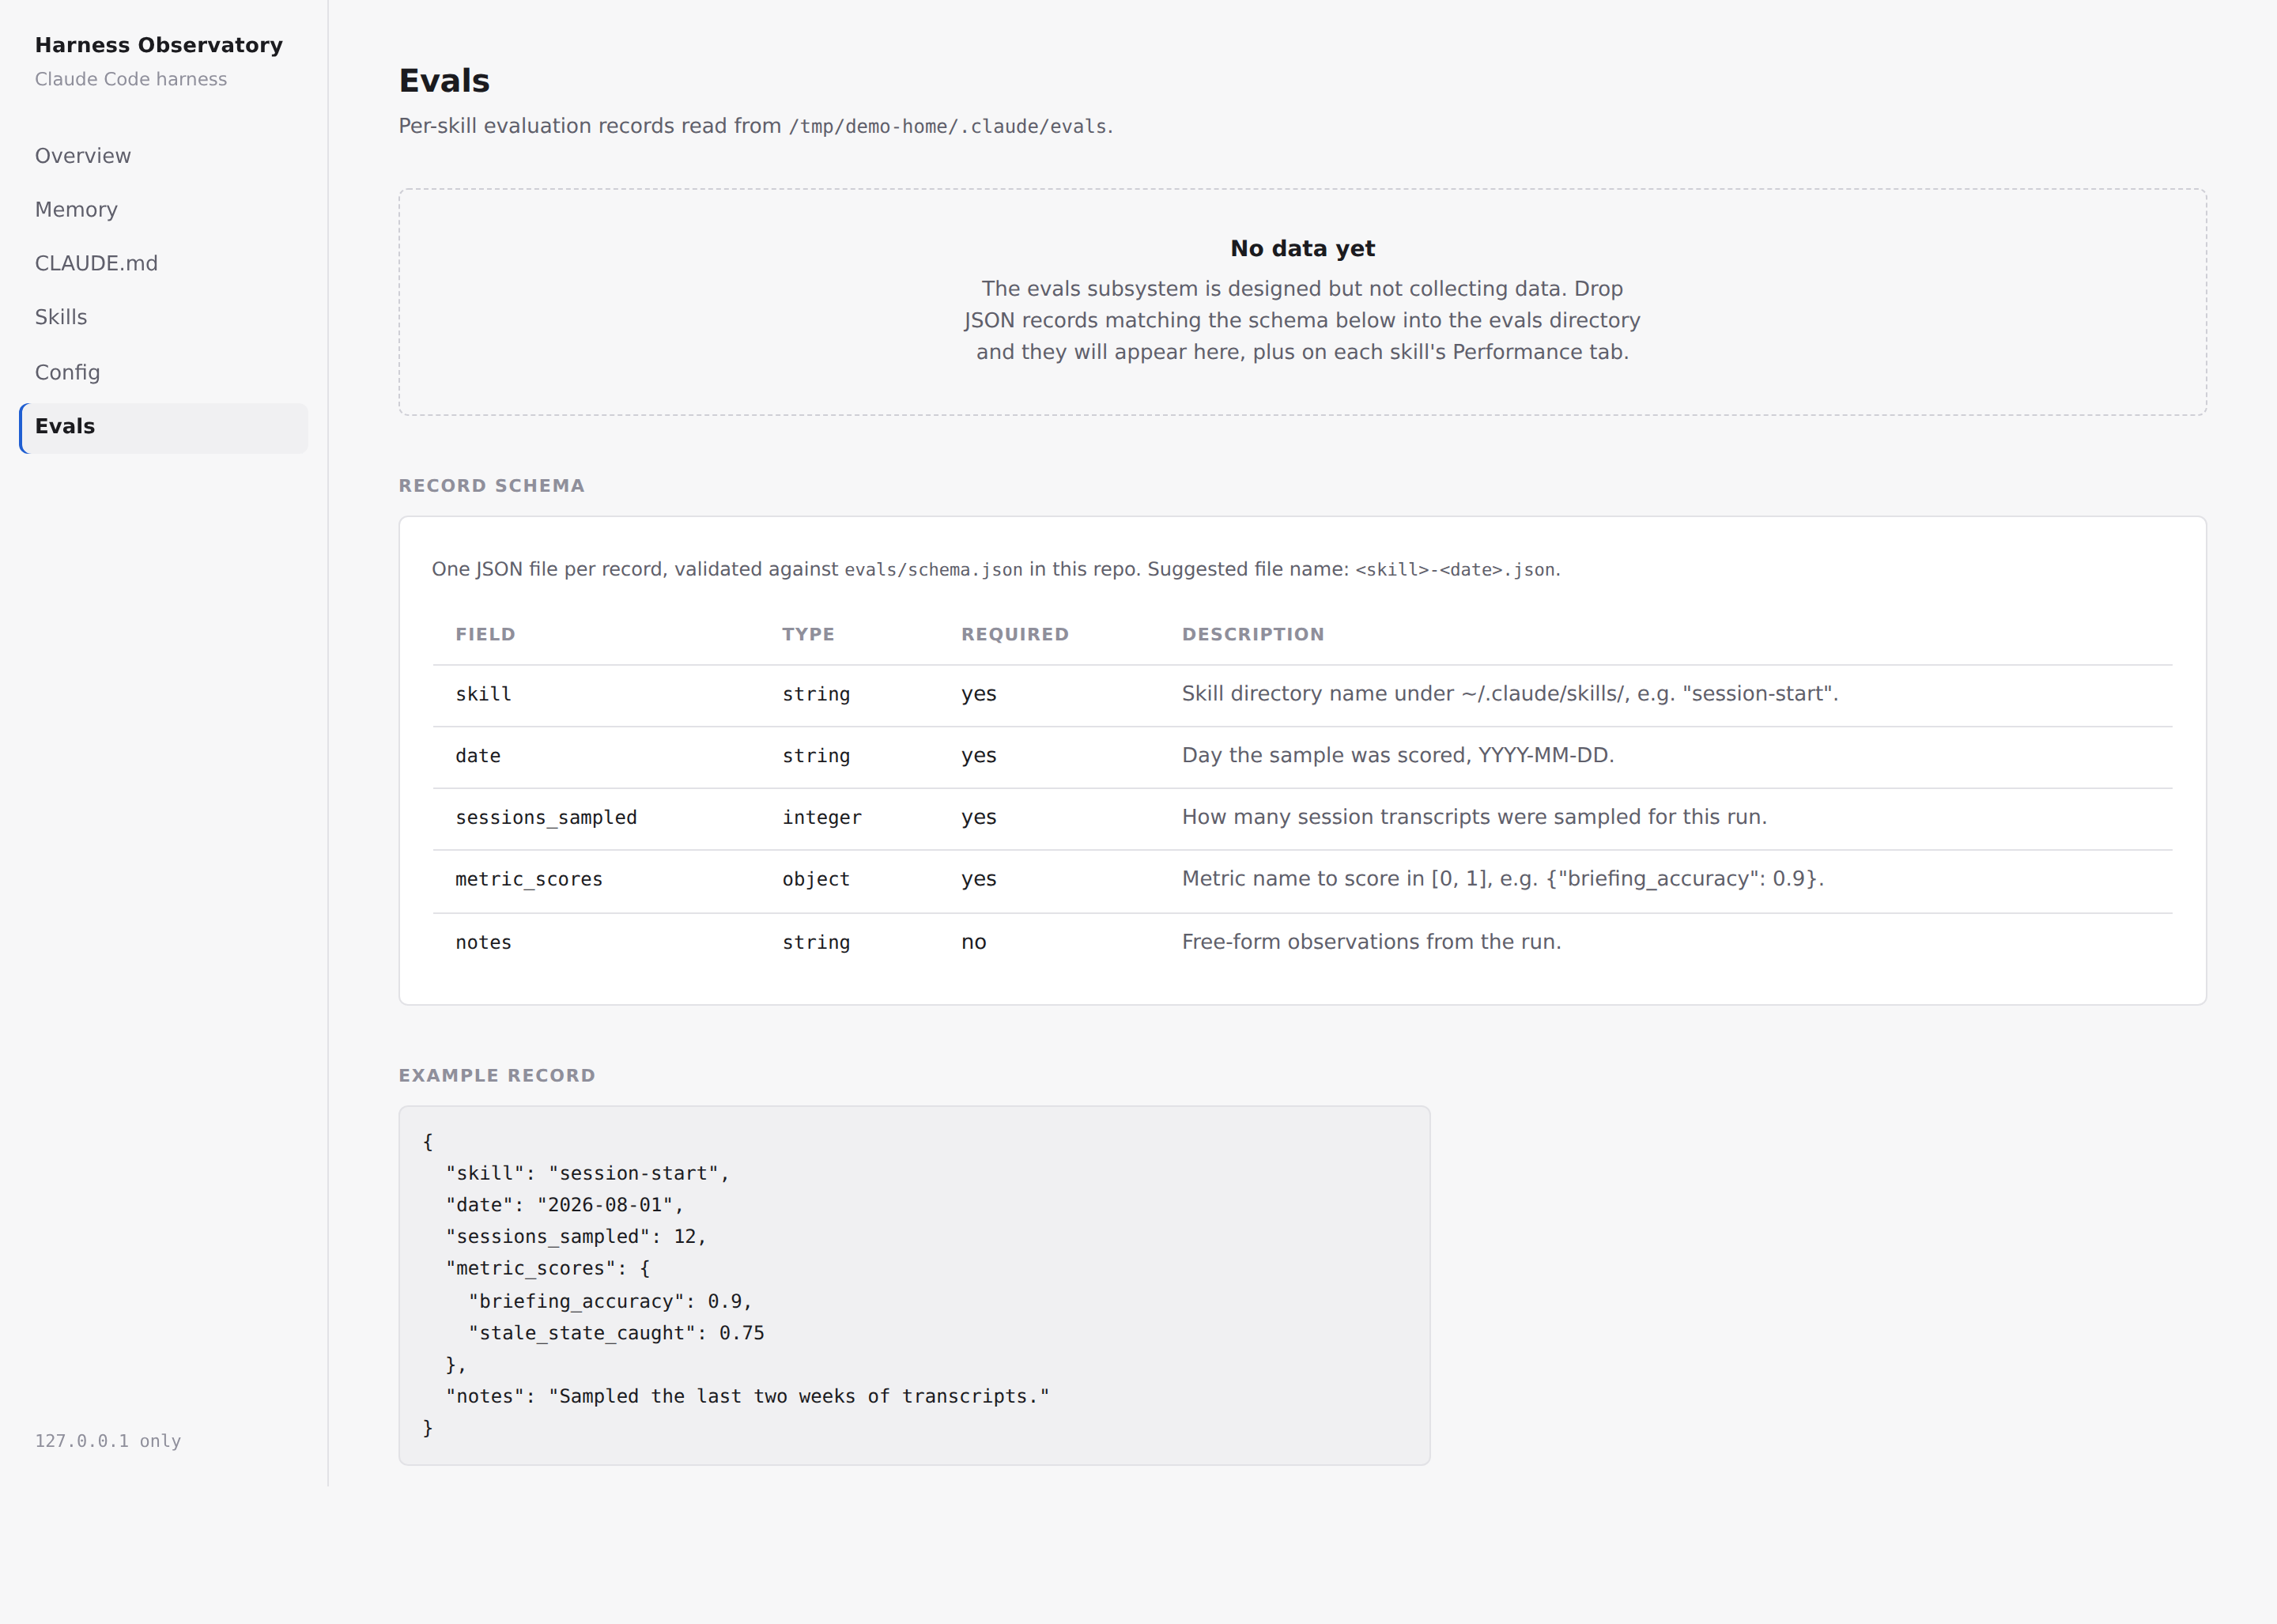 The evals screen, waiting for data. The schema is defined; the measurements aren't running yet.
Versioning tells me what changed. Hooks enforce that checks run. Neither tells me whether a skill is actually performing — whether v1.5.0's brief is as complete as v1.4.0's, whether a skill's cost is drifting, whether quality is decaying as the harness grows. The schema is stubbed and waiting: per-skill records of sessions sampled, metric scores, notes, over time.
On my home setup I've already added the first feeder: skill-usage tracking. Which skills fire most, across sessions. Usage tells me where performance matters most — the hot skills get measured first, optimised first, maybe restructured first.
And here's the bet all of this is building towards. Right now, frontier models do the orchestration and most of the work. Over time, the lower tiers should take over tasks that today need a frontier model — and the skills and the memory loop are exactly what carry them: a well-written skill plus a well-pruned memory is what makes a cheaper model competent at a task it couldn't do cold. But you can only hand a task down when you can measure what a model is actually capable of with the current skills. That measurement is the evals screen's job. It's also the audit's bottleneck seen from the other side: loops stop terminating in my live attention when cheaper models can be trusted to run them — and trust is a measurement, not a feeling.
The raw material already exists — my weekly-review skill mines session transcripts for friction. Turning that mining into per-skill metrics is the next increment. The audit said 2.7. The verdict said the substrate is free and the product is the layer above. The observatory is that layer's first shipped piece — and evals are how it earns the next one. One version bump at a time.